
- Select the data for creating chart.
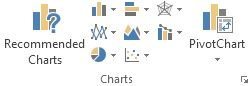
- Click [Insert] > [Recommended Charts].
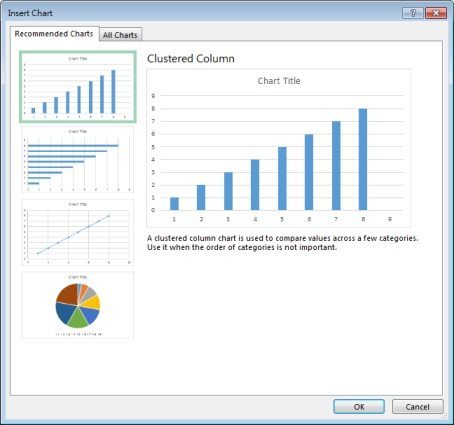
- On [Recommended Charts] tab, scroll down and select the chart suggested by Excel.
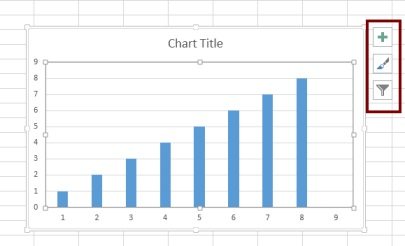
- Use the [Chart Element], [Chart Style] and [Filtering] button to create new chart item. (Such as Axis title or data tab, customize chart layout or edit data displayed in the chart)
Recommended Charts can quickly analyze your data and suggest the most appropriate charts to you.